SitScape is the leader in collaborative User-Defined-Operating-Picture (UDOP) solutions with our award-winning no-coding Digital Enterprise Enablement Platform (DEEP) software.
SitScape’s Web-based Collaborative UDOP and DEEP software, a Commercial-off-the-Shelf (COTS) software product, enables ops and mission users to easily aggregate, correlate, analyze and visualize disparate data and information sources into collaborative visual Common-Operating-Picture (COP), and assemble agile digital enterprise applications with advanced process automation and machine learning, powered by our drag-and-drop Straight-Through-Processing (STP) visual flow-automation environment – done in minutes with just a Web browser without programming.
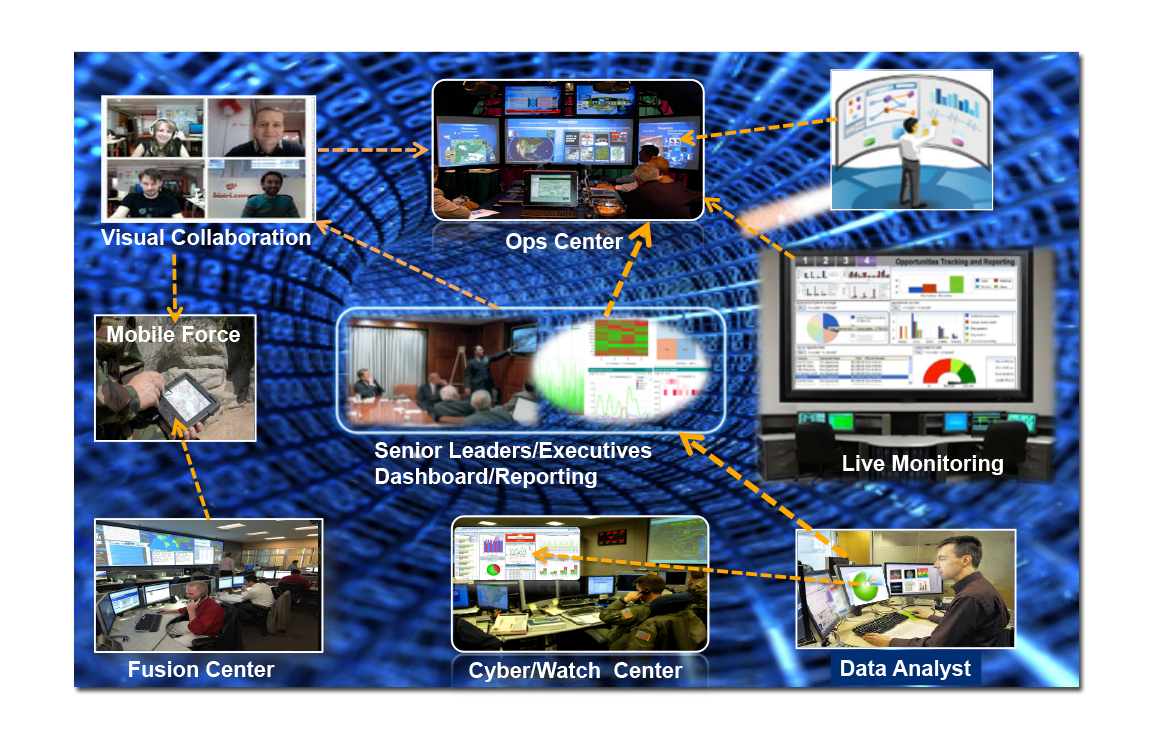
Shared Situational Awareness, Operational Monitoring, Smart Alerts
Create real-time Monitoring Console, Common-Operating-Picture (COP), and User-Defined-Operating-Picture (UDOP) on-the-fly; Aggregate live applications, web sites, data sets from disparate sources with simple drag-and-drop; calculate and monitor Key-Performance-Indicator (KPI) at real-time; set thresholds and conditions for smart alerts. Collaborate together using shared virtual workspaces to support Shared Situational Awareness over shared visual COP and UDOP.
Collaborate Dynamically in Real-Time With Shared COP and UDOP
Support Real-time chat, drag-and-drop to share anything live across users; co-editing or co-working on shared charts, analytics, documents, maps, images etc. together at real-time; annotate on shared operating pictures; desktop screen sharing; video conferencing, voice-Over-IP etc.
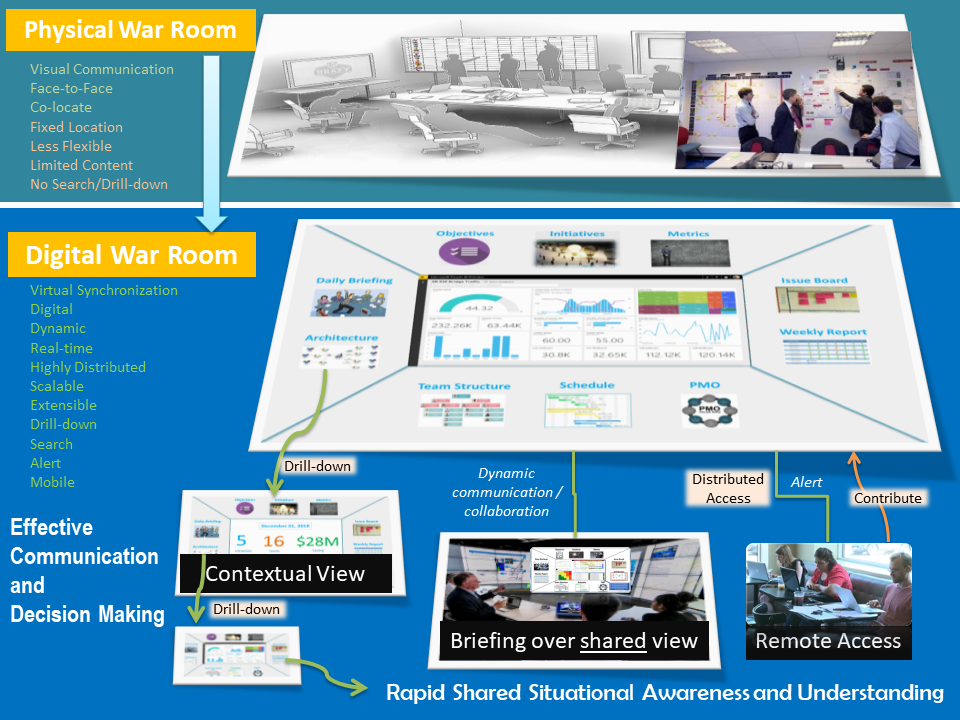
Digital War Room for Distributed Knowledge Sharing and Decision Making
Using the collaboration and information sharing features of the product to create digital war rooms for distributed teams’s information sharing, situational understanding, joint briefings and rapid data-drive decision making
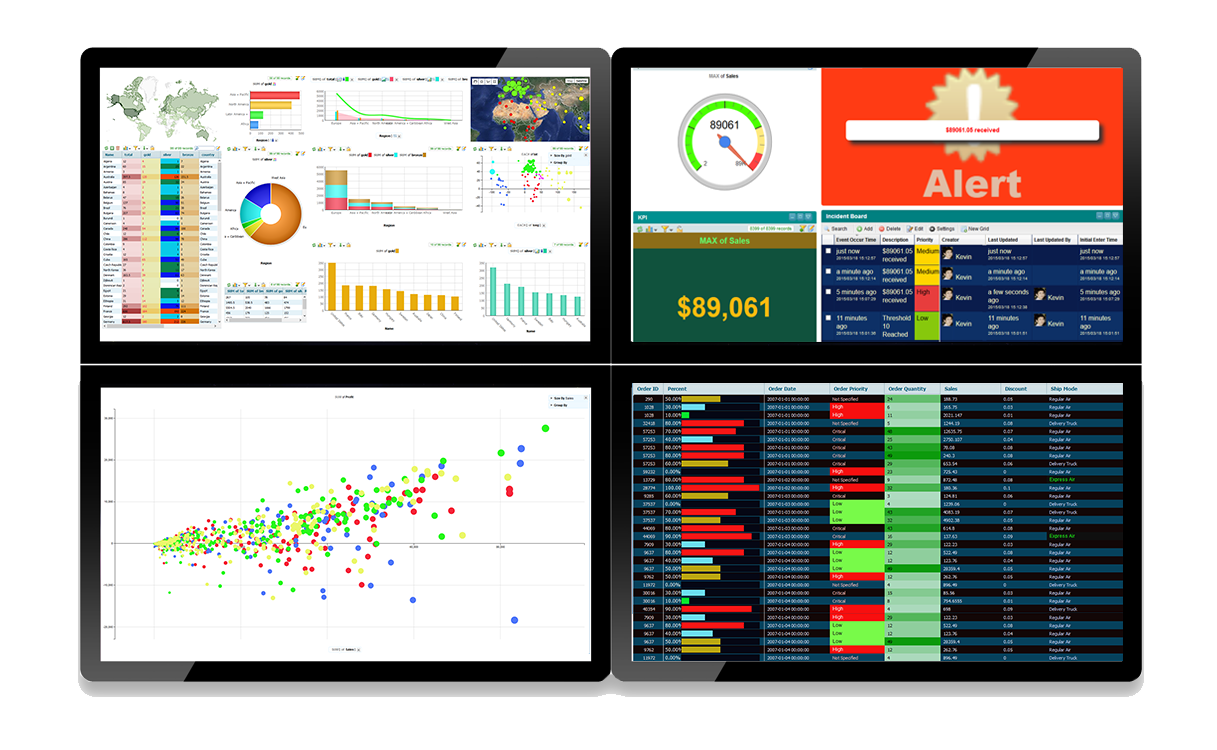
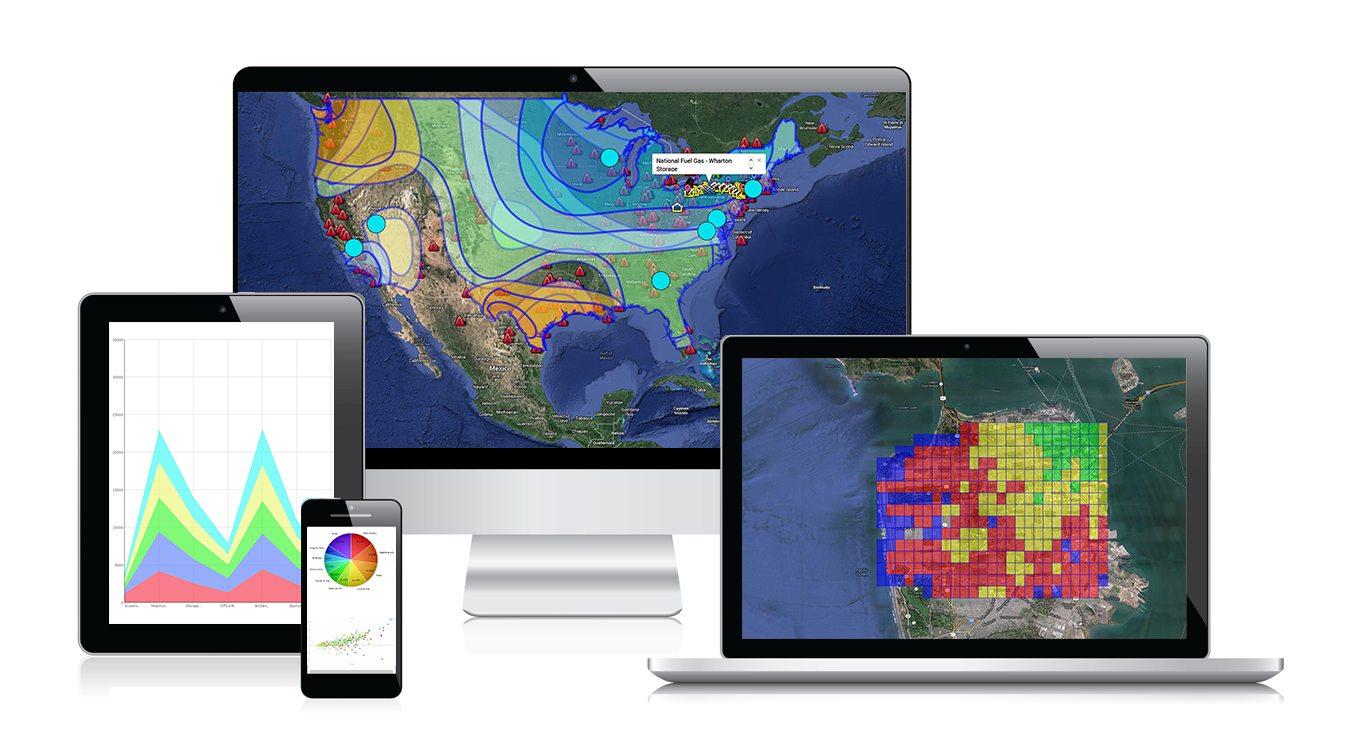
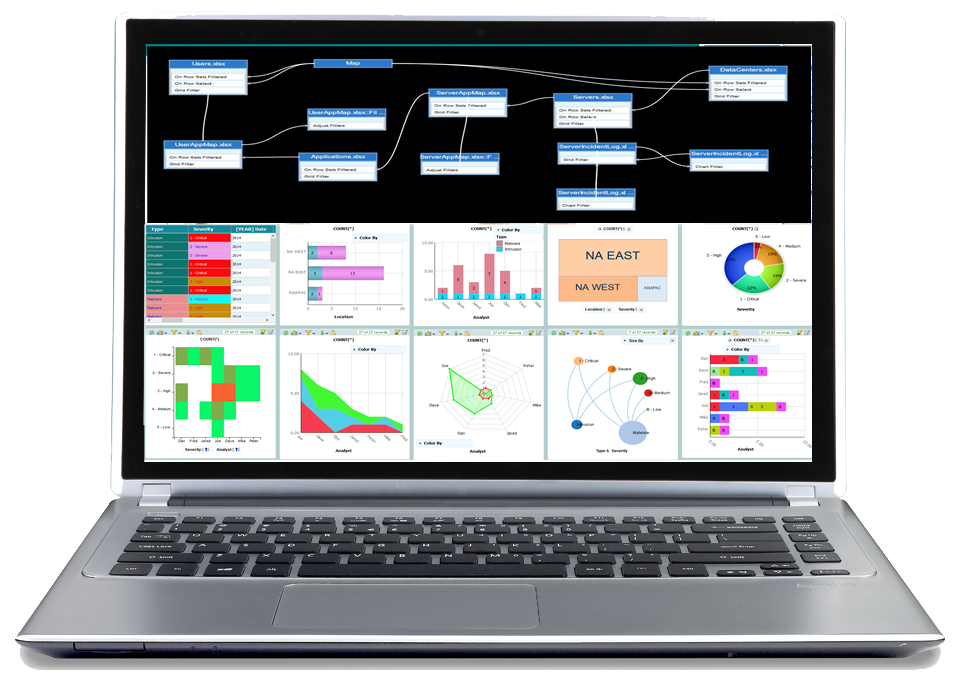
Beautiful and Interactive Dashboard and Knowledge Board with Drill downs
Share Visualization, Intelligence and Rich Content easily with strong security using interactive dashboard and knowledge board; create dashboard or visual monitoring console from historical data as well as we from live feeds and streaming data.
Gain insight with Agile Analytics and Data Discovery
Create visualizations and KPIs with simple drag-and-drop; link data sets and visualizations together automatically; slice-and-dice data; perform unlimited drill-down and drill-through at-ease; fuse disparate data sets (live and historical) together; blend visualizations on-the-fly; conduct visual and interactive data discovery at the speed of thought.
Link Data and Discover Relationship with Agile Data Correlation
Easy-to-use and powerful data correlation powered by SitScape’s patented Data Fabric engine enable visual data correlation of disparate data sources as well as live applications, be it live or historical, on-the-fly with zero programming.
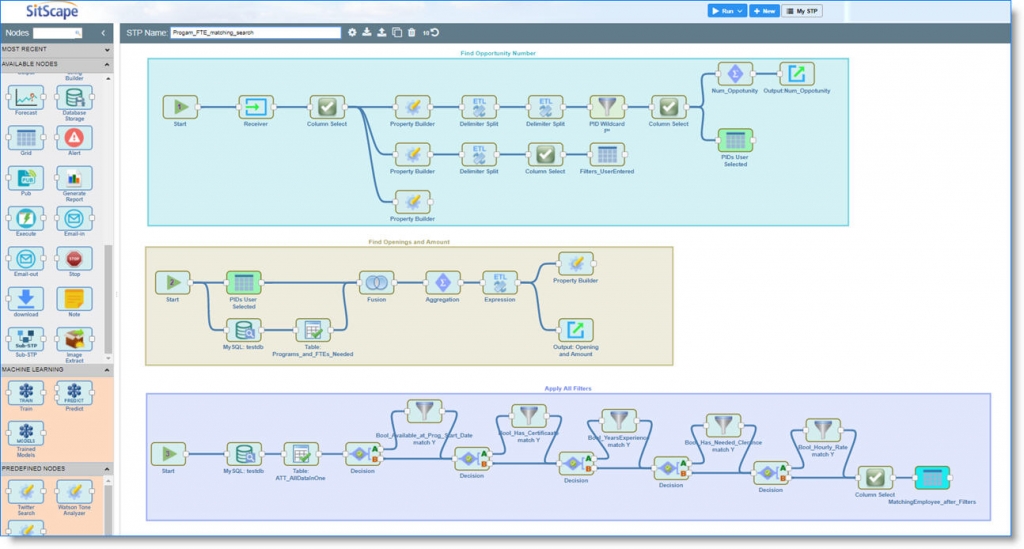
Automate Data Process Flow and Business Logic in STP Studio
SitScape’s Straight-Through-Processing (STP) visual environment enables non-programmers to use drag-and-drop to create automated data processing flows such as ETLs, data integrations, data fusion, scheduling, alerts, analytics and machine learning; can also assemble agile business application logic and workflows easily without coding. The STP is also the backend engine of SitScape’s overall DEEP software platform when combined with our drag-and-drop UDOP visual front-end and graphical user interface designer.
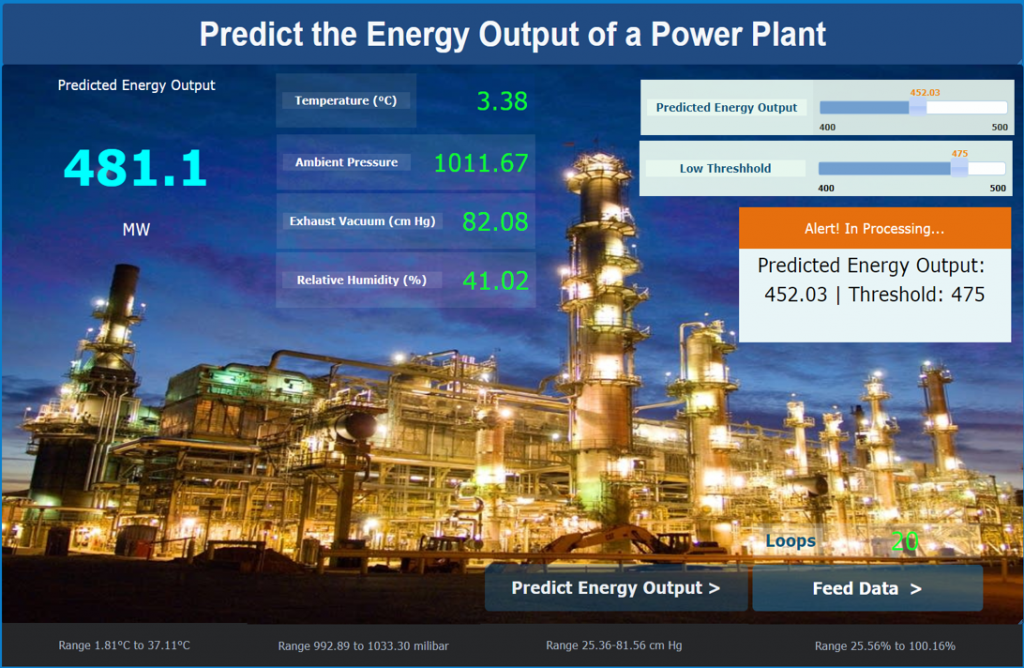
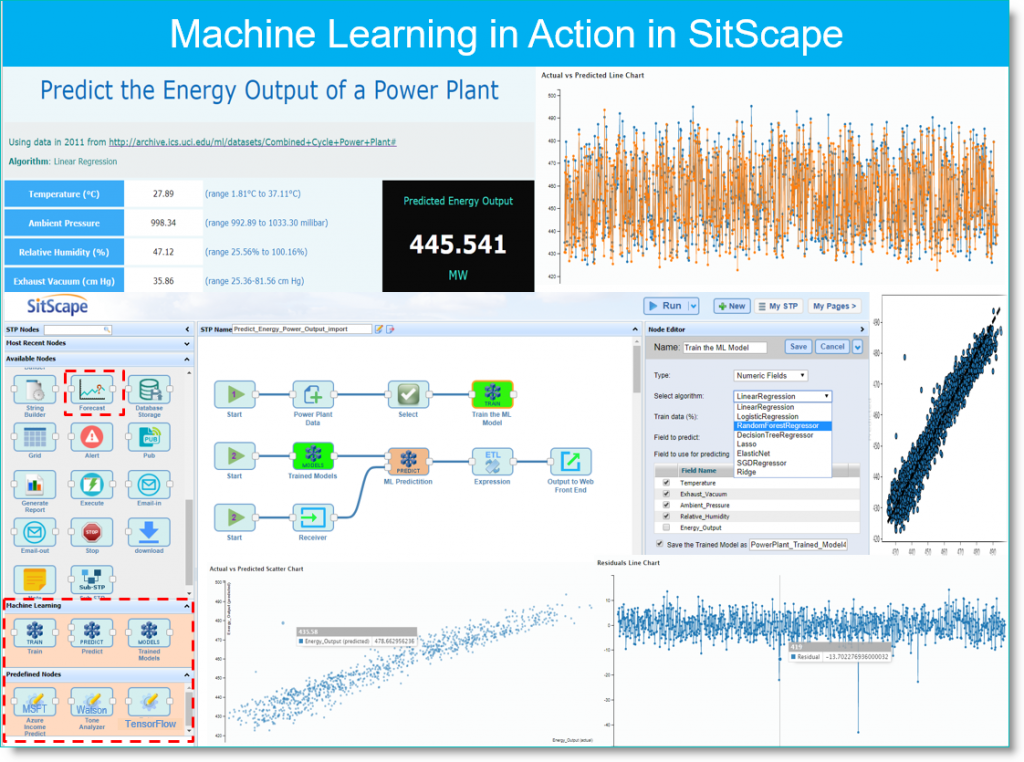
Predictive Analytics and Machine Learning
Create and train Machine Learning Models in the visual STP’s environment with simple drag-and-drop, run simulations and learn from the data, conduct predictive analytics with new data and trained models, fine tune the models, and embed machine learning and predictive analytics right into your business process for amazing automation and optimization.
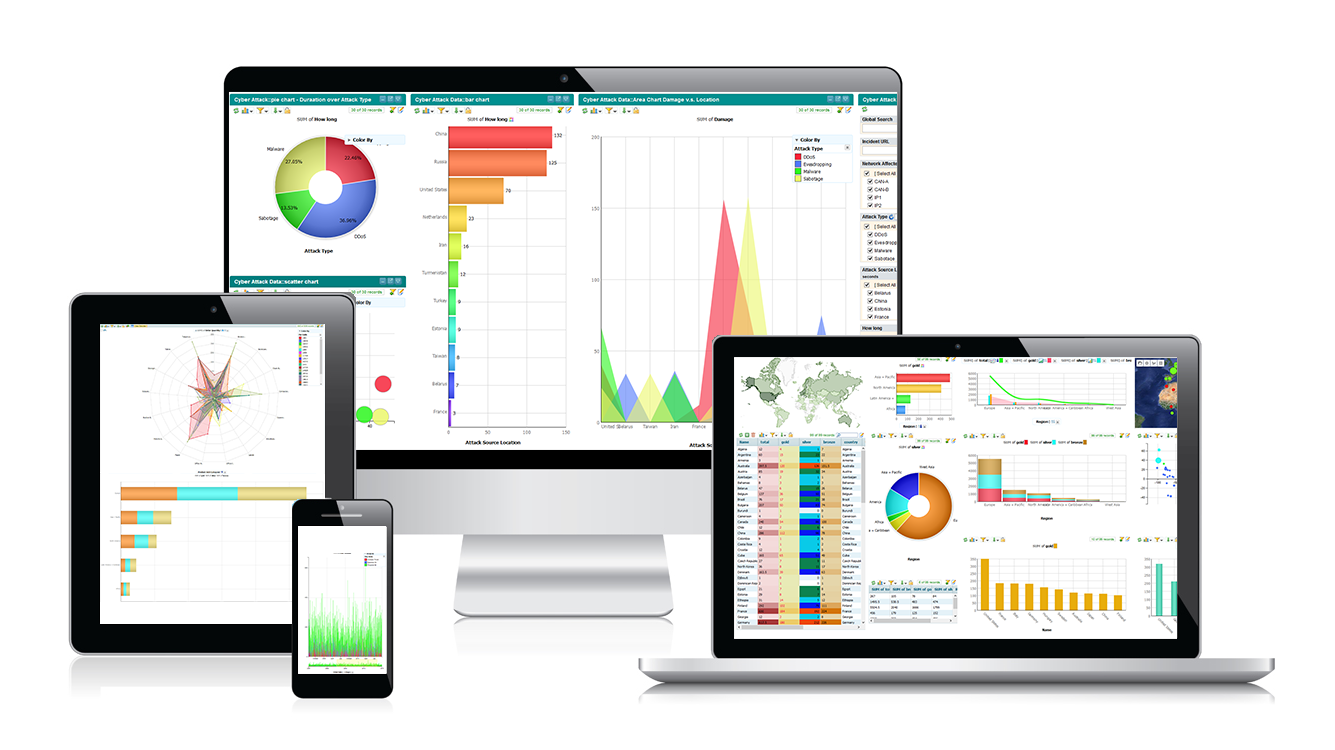
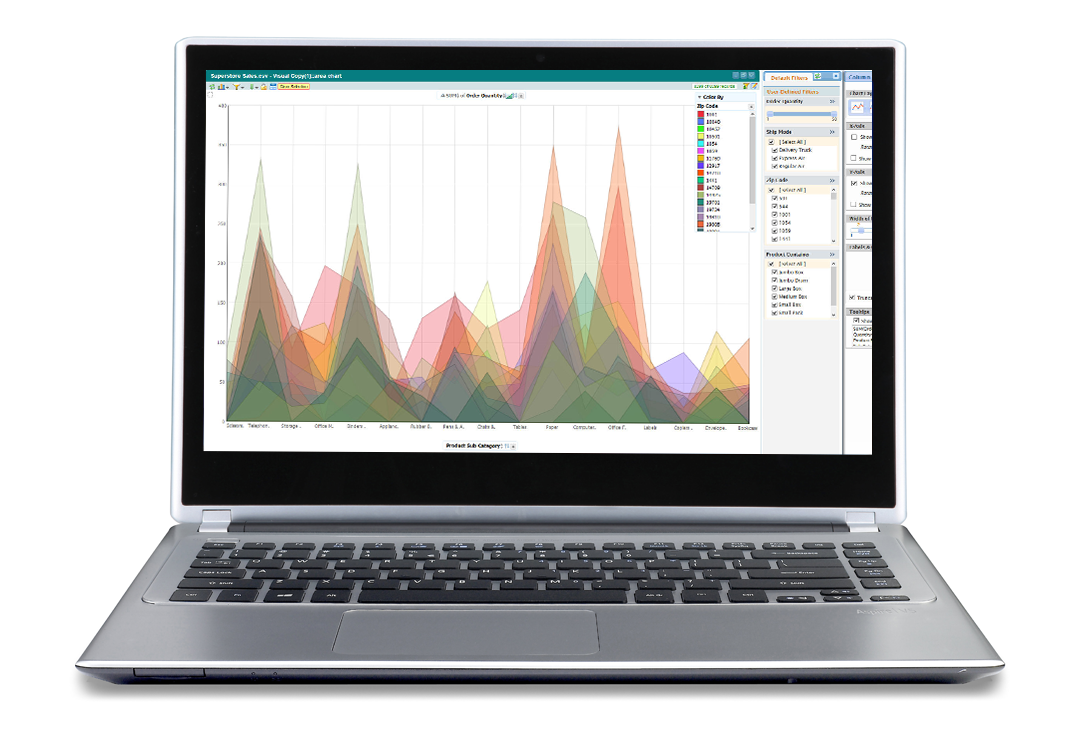
Talk to your Data with Self-Service Visualizations
Create Instant and Interactive Data Visualizations in seconds with just a Web browser and Zero Programming. With drag-and-drop and a few mouse clicks, business users can create powerful interactive visualizations from disparate data sources, discover pattern visually, and talk to their data intuitively.
Key Features

Collaboration and Digital War Rooms

Data Discovery and Predictive Analytics

Embeded and Automated Machine Learning

Assemble Enterprise Apps with no-coding

Real-time Monitoring & Alert

Visual Data Correlation and Process Automation

Strong Security

100% Browser-based
